CARBON FOOTPRINT,
CARBON FOOTPRINT,
2022
Adobe Illustrator, Adobe Photoshop
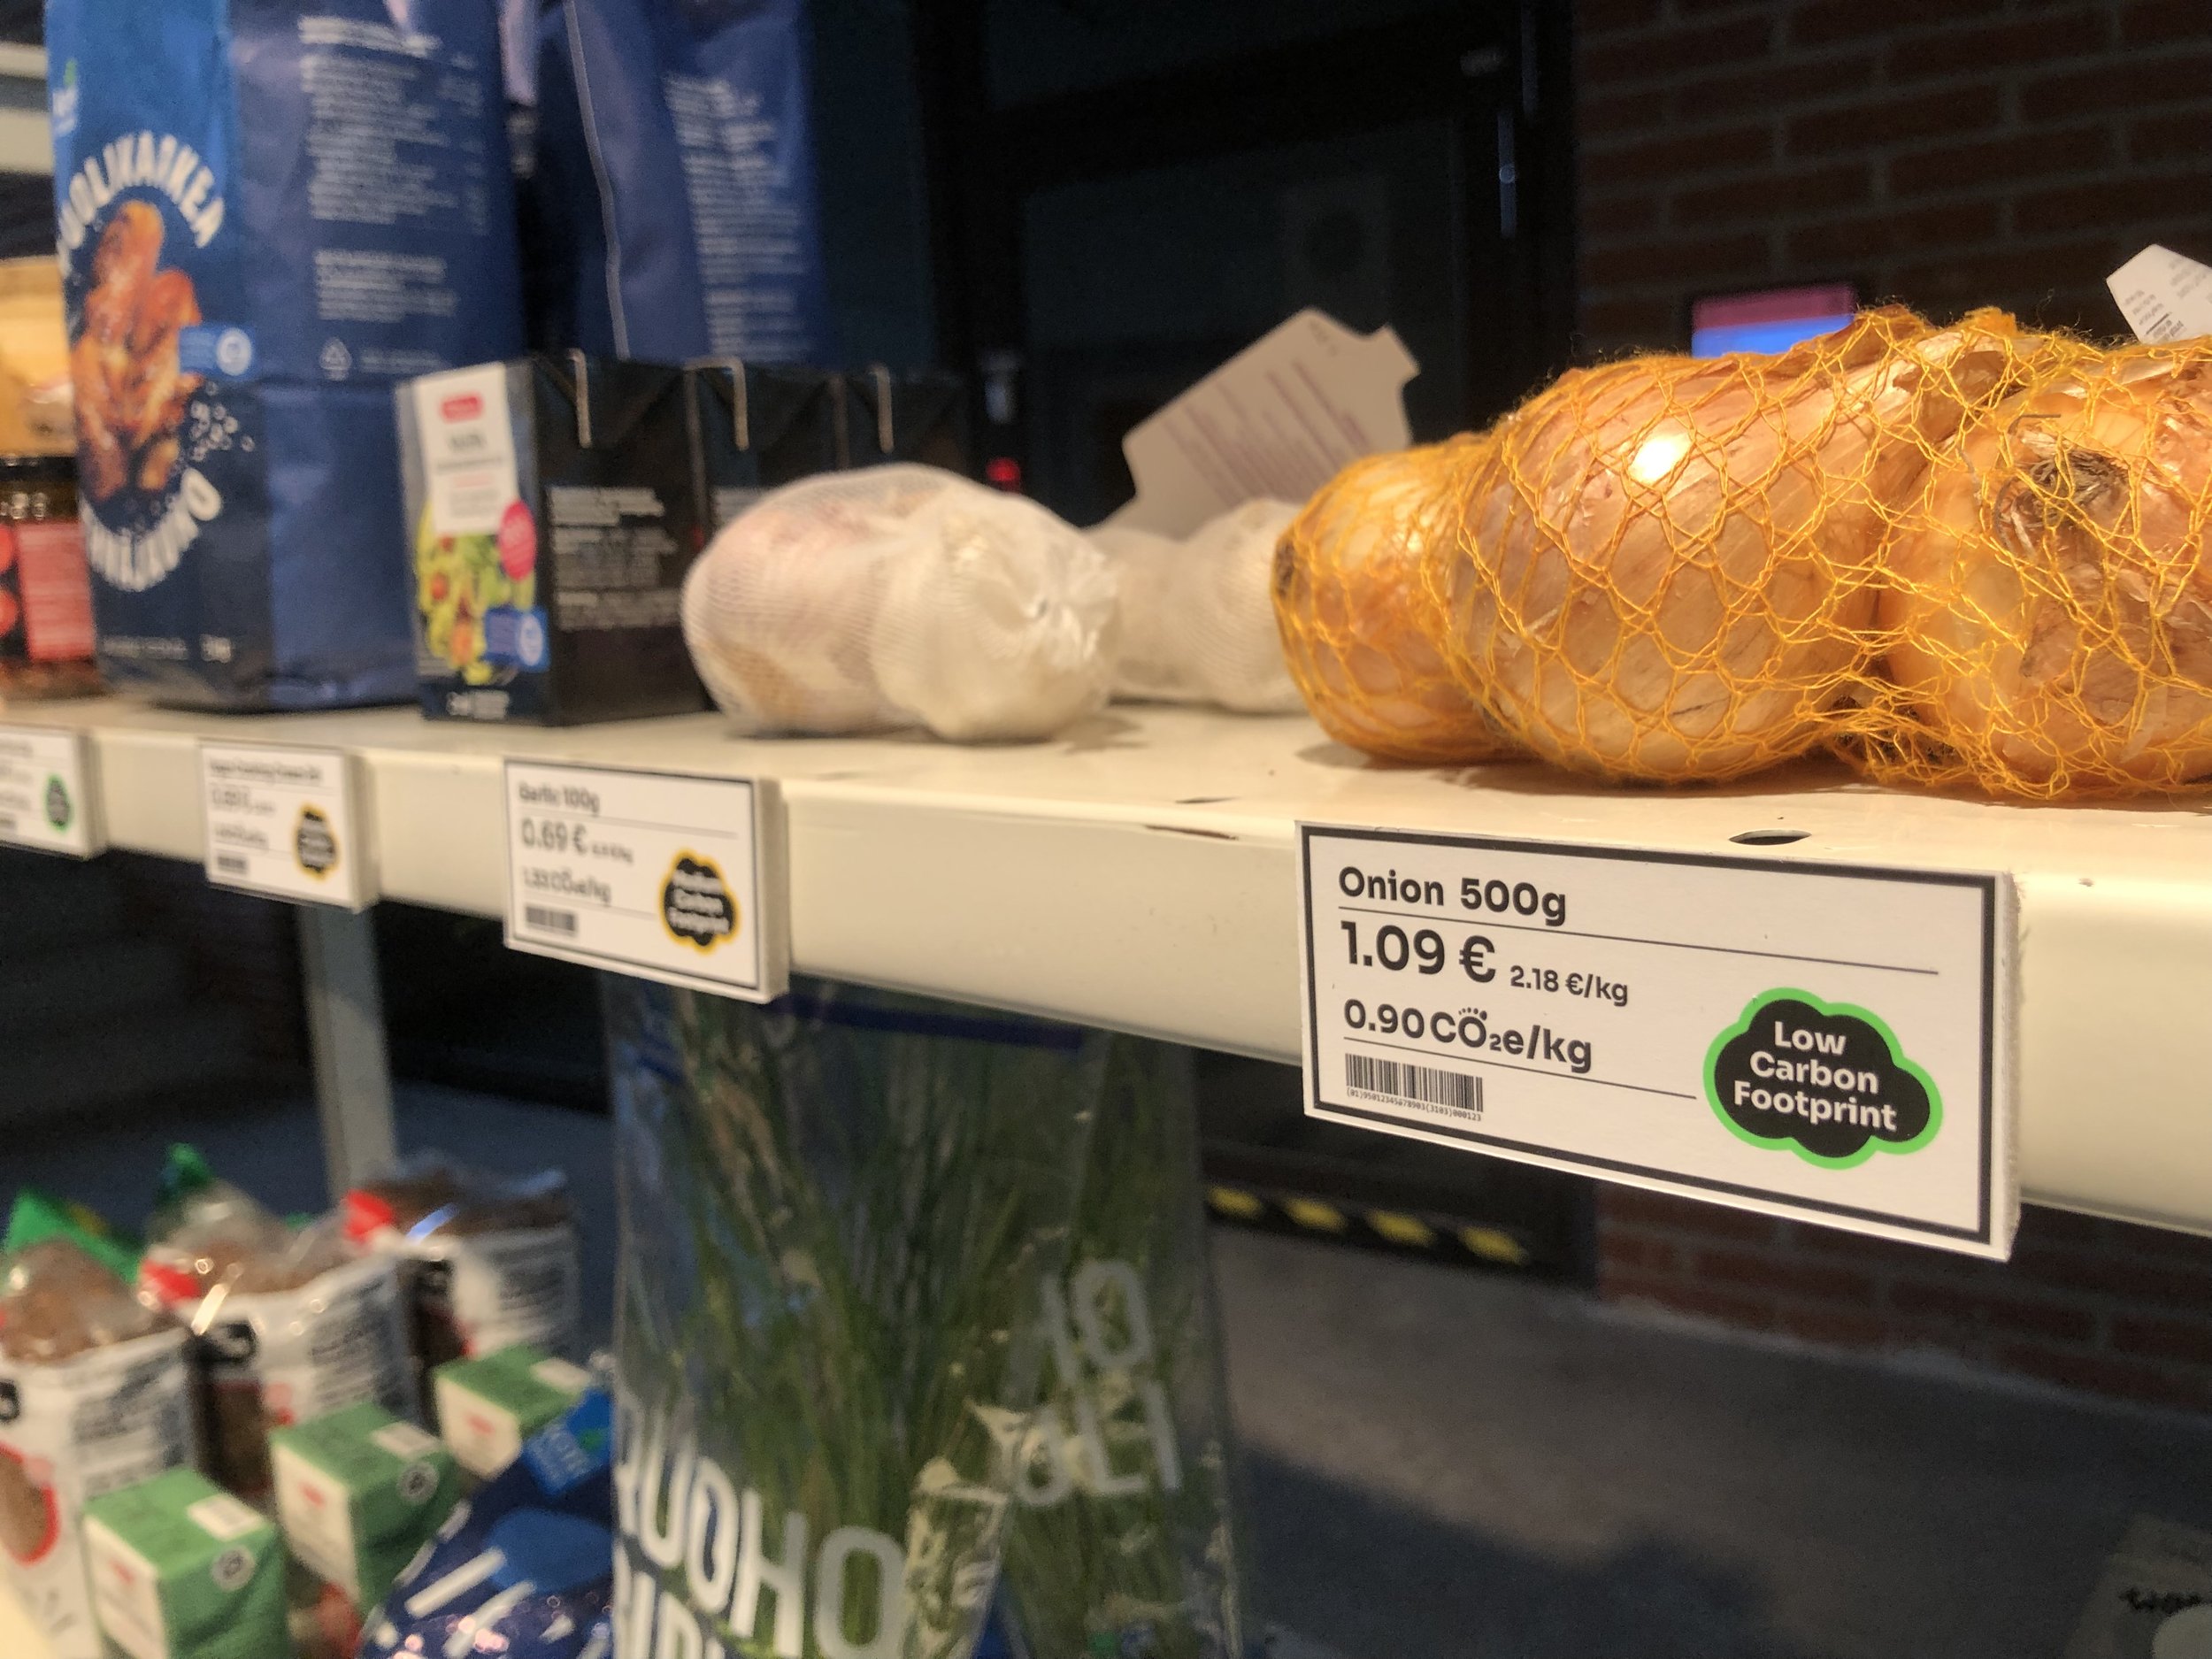
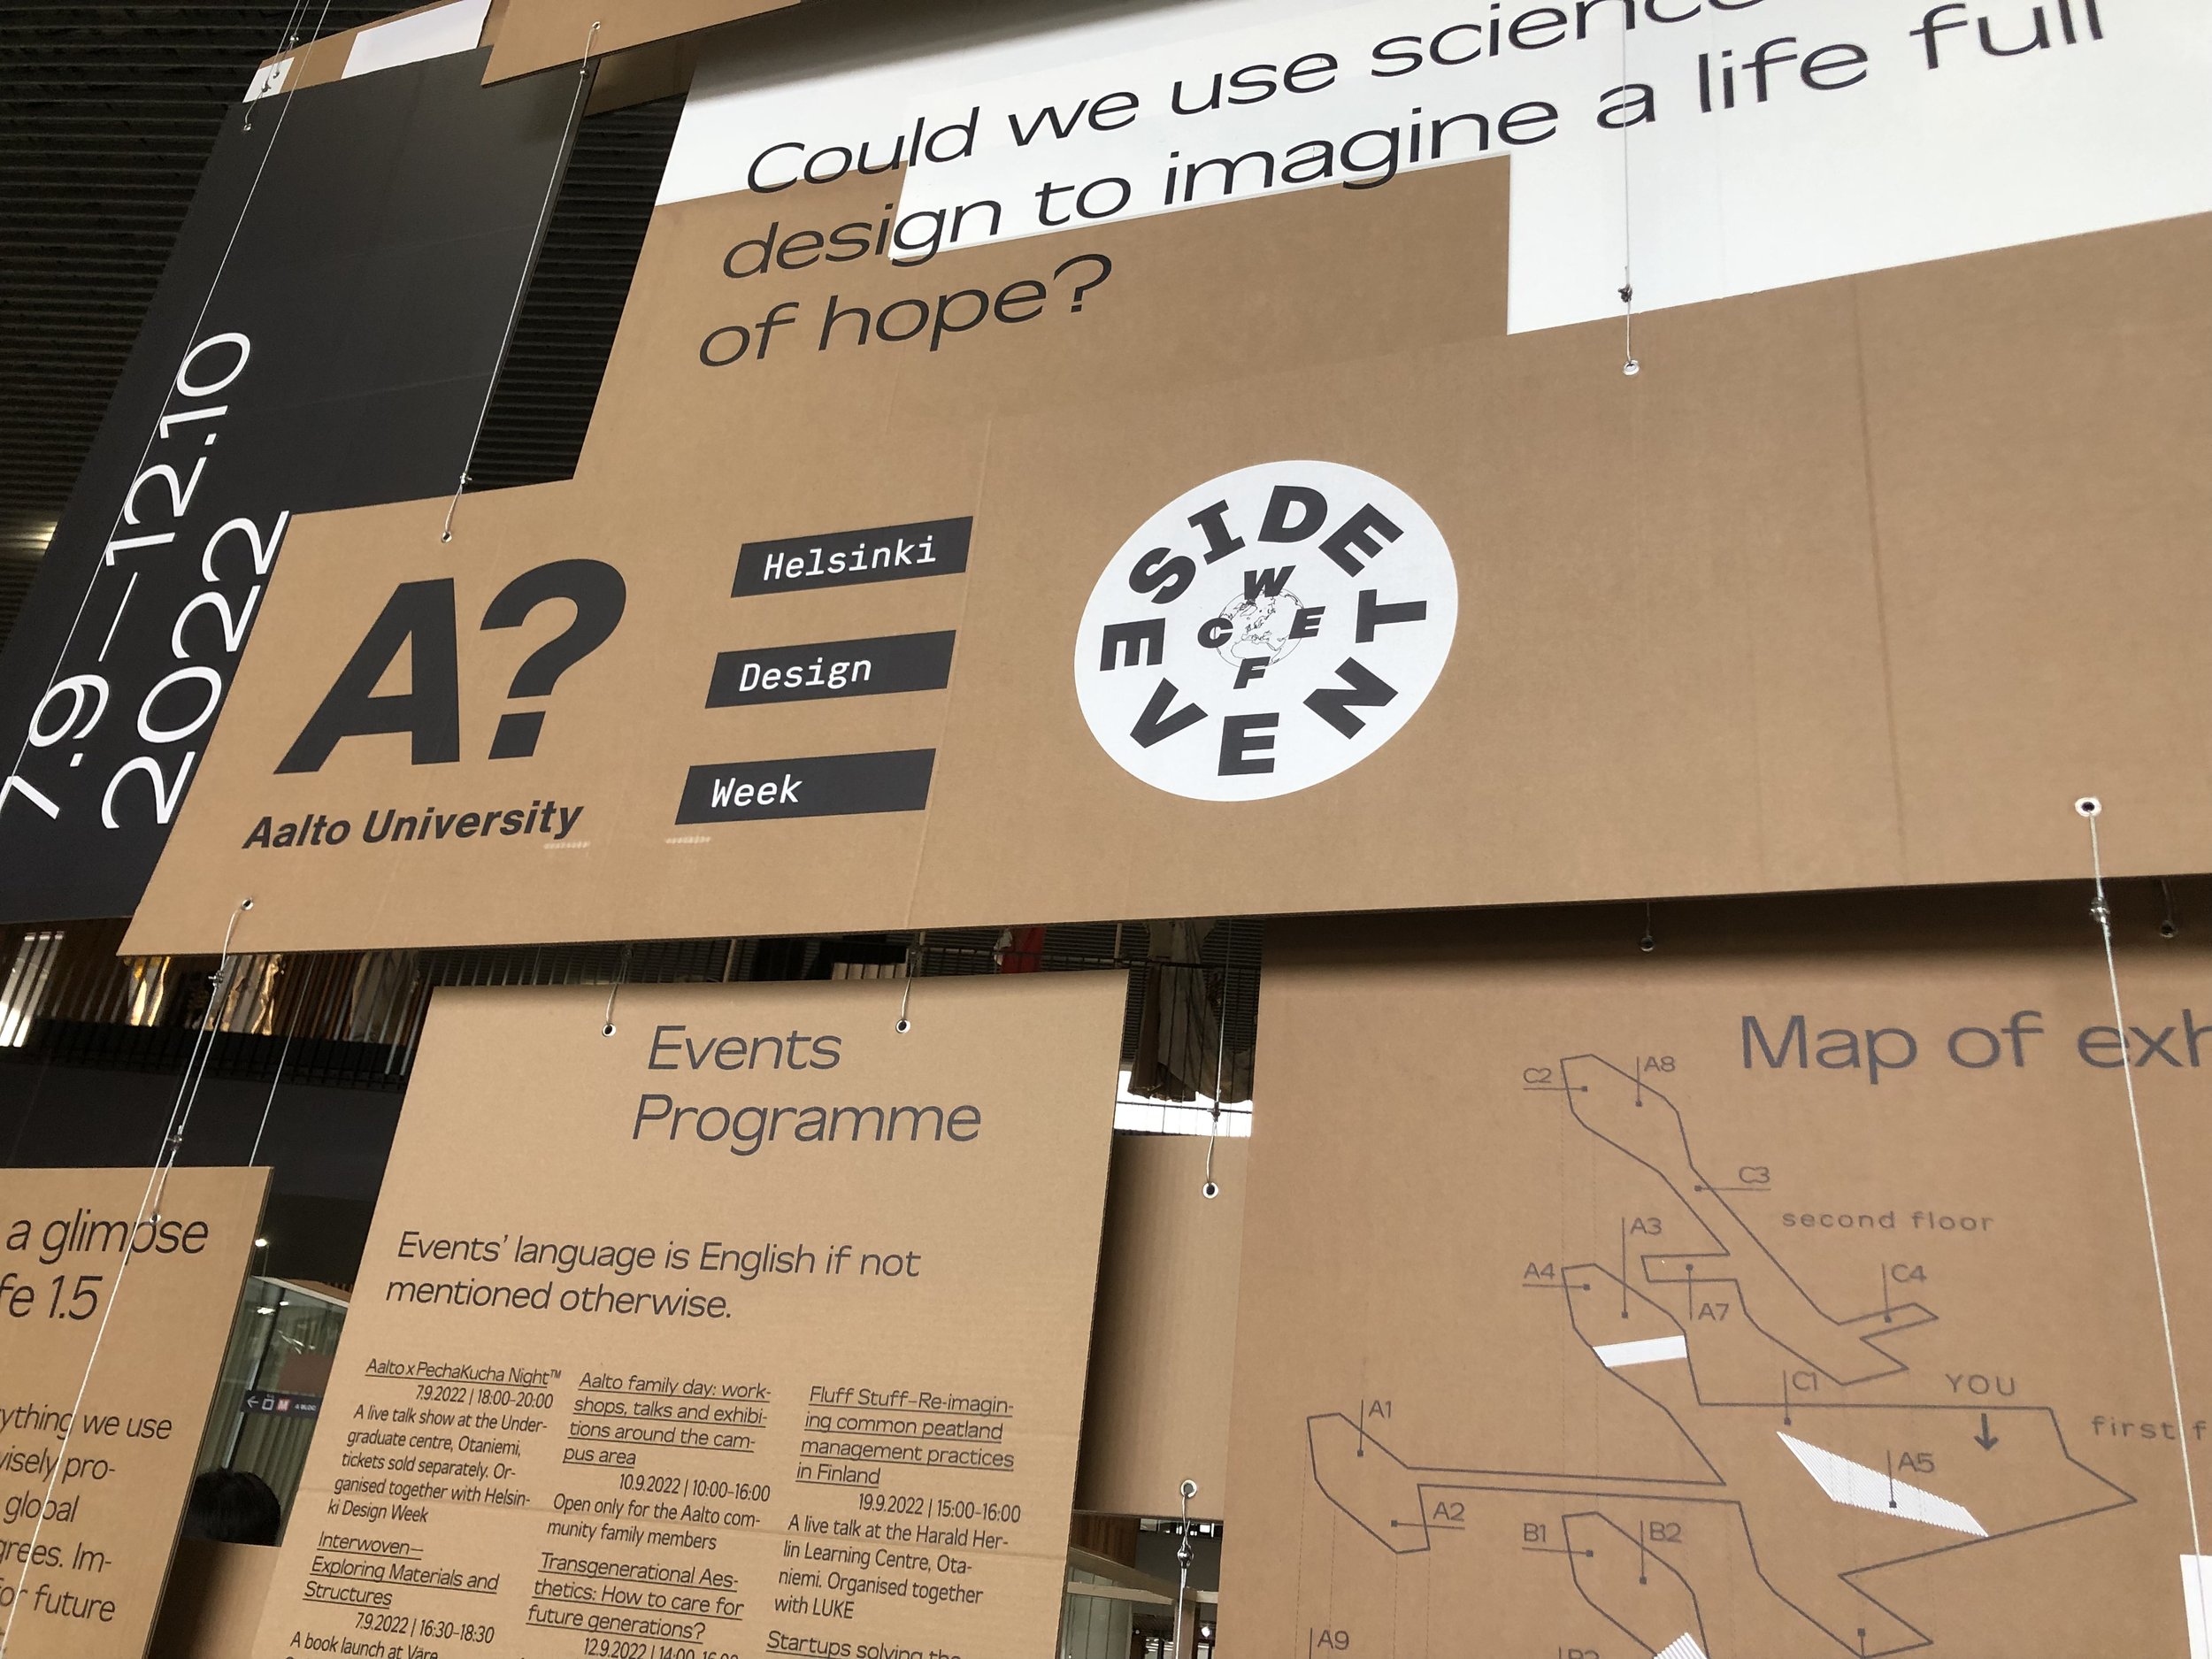
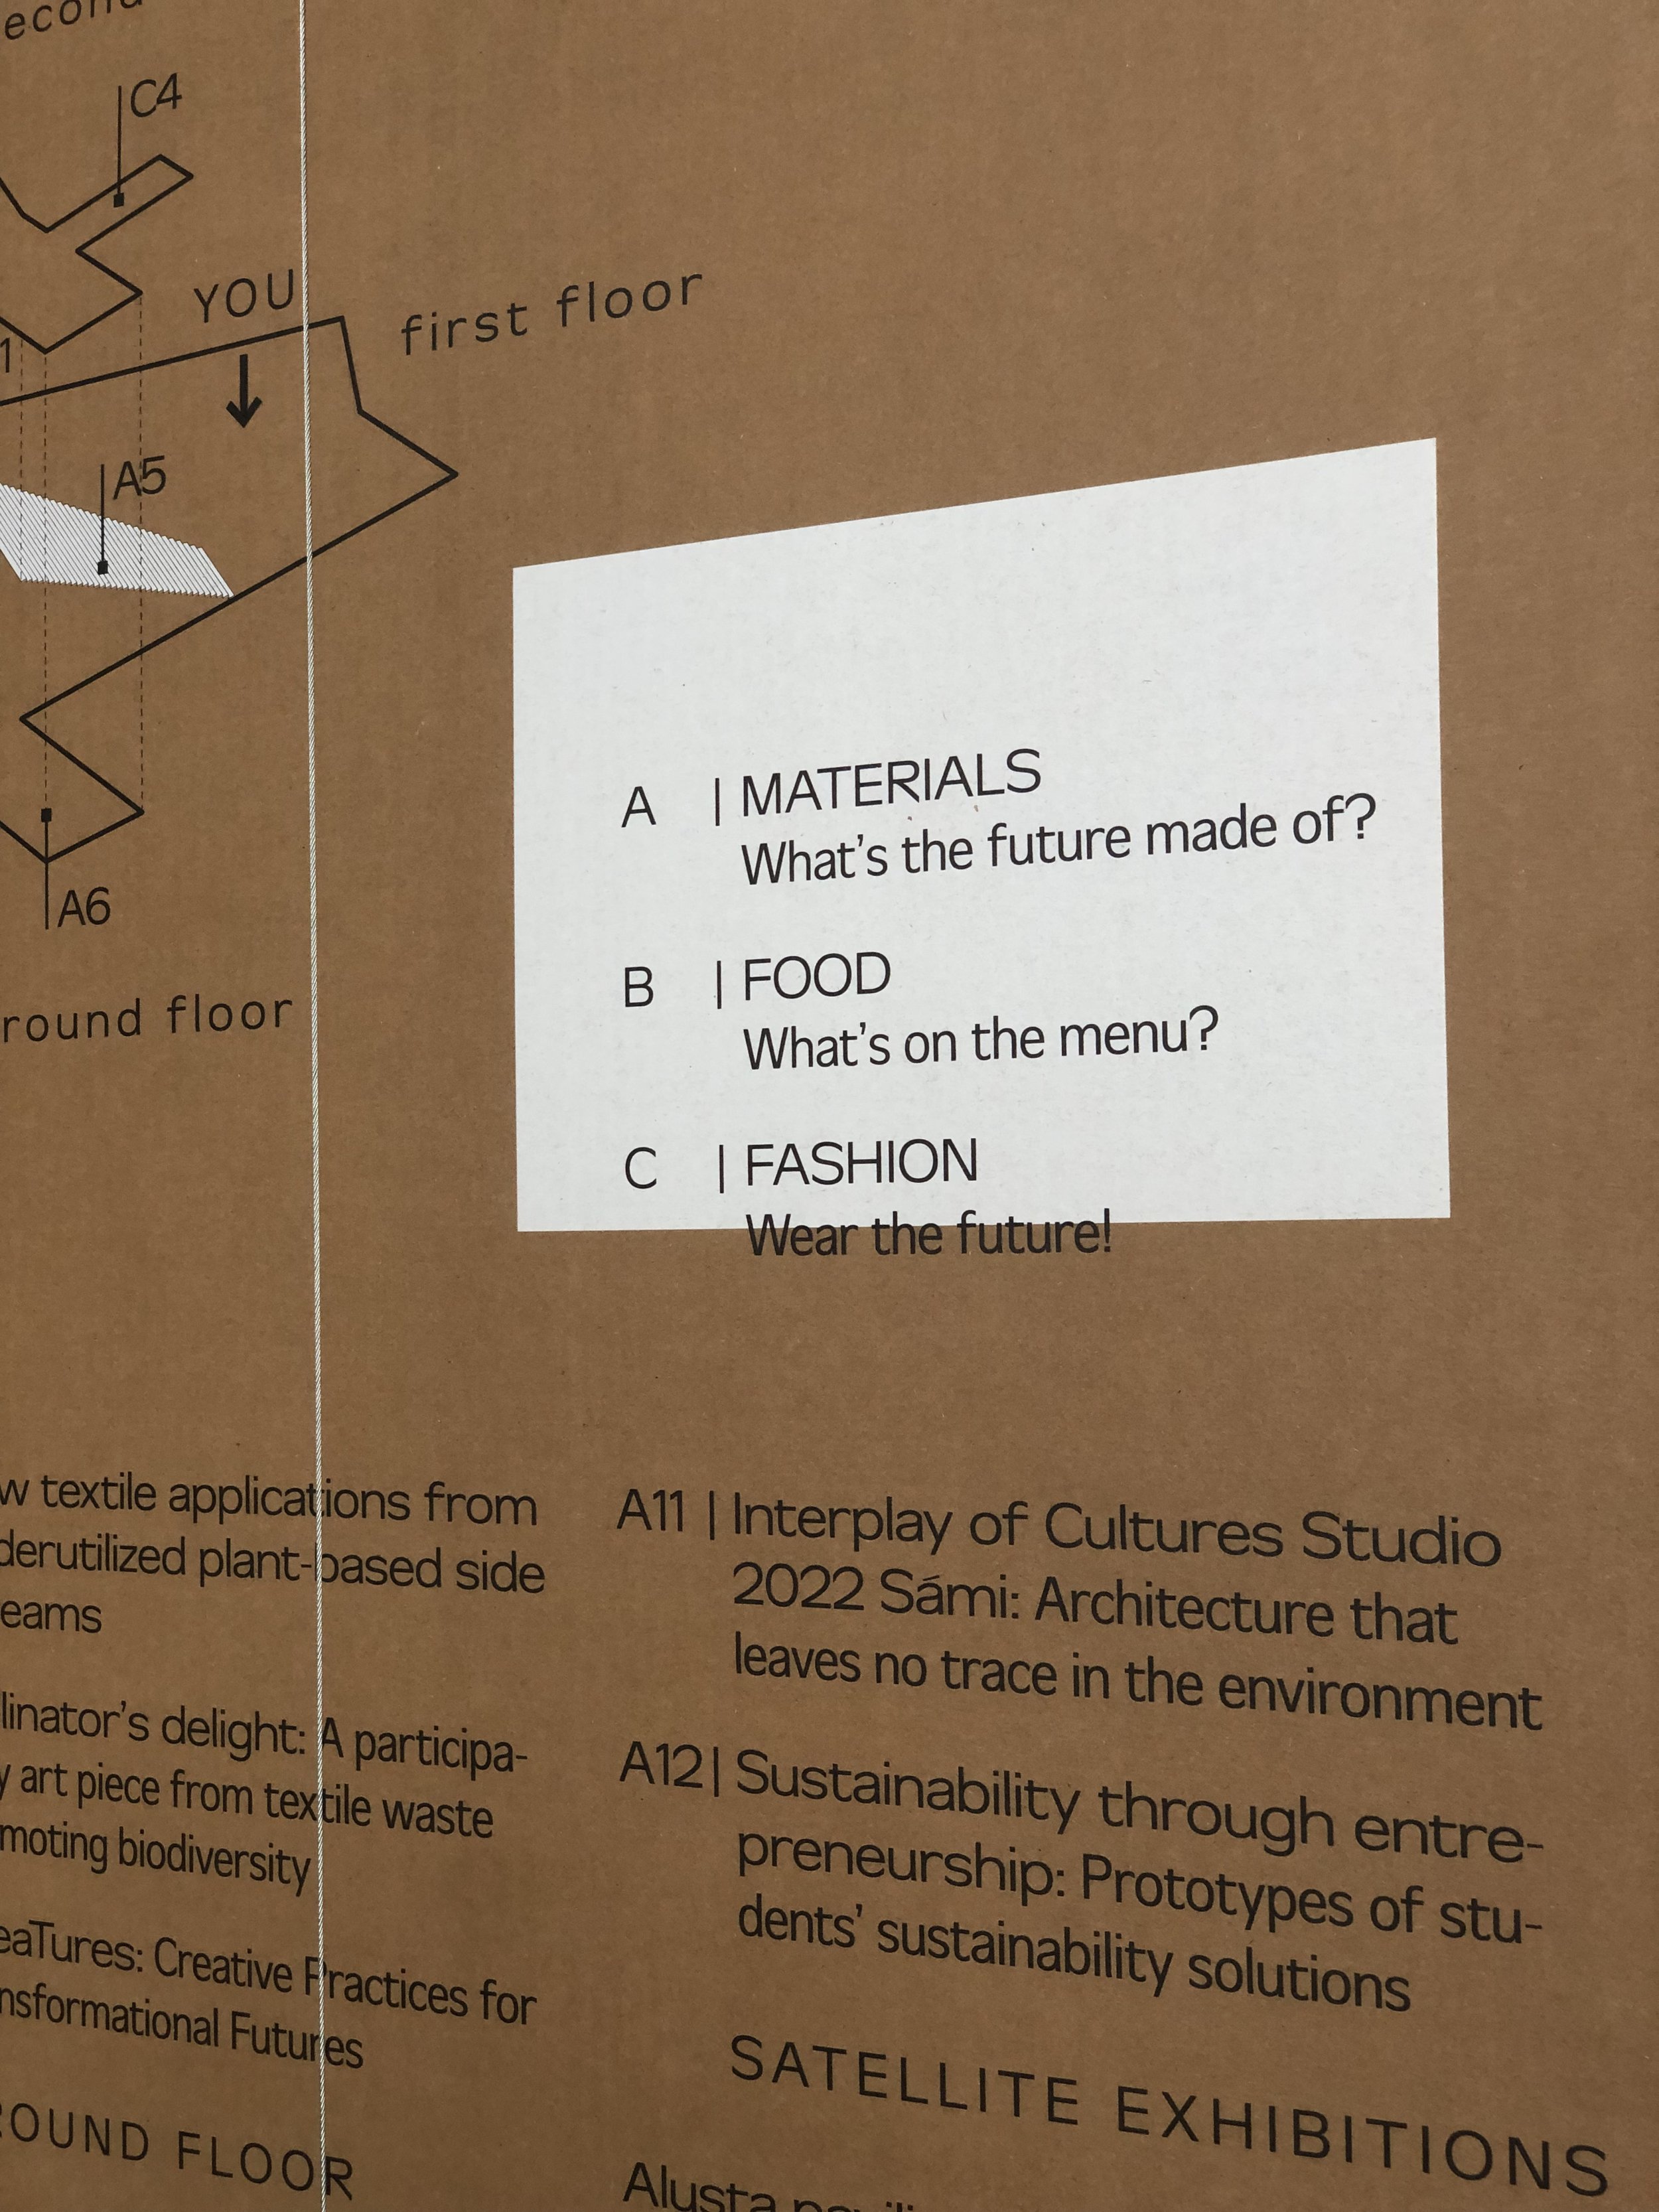
This project was selected for & exhibited at
HELSINKI DESIGN WEEK
(DESIGNS FOR A COOLER PLANET)
on Aalto University's Campus
PROJECT CREATED BY:
Amirali Moradi, Ada Pärnänen, Laras Zita Tedjokusumo, Sofia Wasastjerna, Vilma Torkkeli
-
Color palette/font/icons
About
About
Main Challenges
-
Inspiration & Process
Inspiration
Process
Graphs
Main Findings from the Interviews
Personas
Our Approach
-
Final versions of:
Step 1: Learn
Step 2: Choose
Step 3: Track & Evaluate
Conclusions:
Limitations
Wrapping Up
How Does our Concept Help?
The Big Picture
References
Color Palette
Green, blue, orange, yellow, & pink
Font
Sora
Icons
Cloud
ABOUT
Visualizing and communicating carbon footprint & sustainability impact by exploring the question: How might we help Finns make better, more sustainable choices in grocery stores with the help of visualizations?
MAIN CHALLENGES
Figuring out which areas to focus on inorder to create a meaningful and, ideally, long-lasting impact.
Inspiration & Process
INSPIRATION
For our final designs, we wanted to ensure that consumers would stay motivated and not feel overwhelmed, so we designed our campaign in an approachable way. This includes more positive wording, a vibrant color palette, and simple illustrations. We used this same styling for presenting the data below as well (Current Situation & Objectives).
PROCESS
Our process included understanding the problem (research and lectures), defining the problem (visiting & observing grocery stores, and brainstorming sessions), concept planning (benchmarking), data gathering (interviewing stakeholders and resisting grocery stores), and refining the concept (designing the prototype and finalizing the design).
My visualizations of the data, where the orange line looks at the CO2 levels related to food, and blue looks at the the total CO2 levels
My visualizations of the data, where three food categories are the focus
INITIAL IDEAS
To evaluate our initial ideas, we discussed with the footprint calculation expert Michael Lettenmeier who also functioned as the tutor for this project.
Michael challenged us and asked us to look at the solutions from different perspectives. We realized that focusing solely on the consumers and their behavior was not enough, but also the S-group and the producers, as well as their respective goals, had to be taken into account. Michael was particularly fond of the ideas that tackled the physical store: shelving according to footprint levels and visualizing the CO2 footprint on the receipt. He furthermore made us aware of the fact that although a categorization system might upset producers of high-intensity products, this might mean that the producers eventually would like to change and that this is how we might have the potential to accomplish system-level change.
After the discussion, we were left with a few questions:
What would be the best way to categorize the products?
A product-level categorization would not be the most feasible, but what would the alternative categorization be?
According to which data would we calculate the footprint?
And what would be the most effective way to visualize carbon footprint?
Would simply footprint be enough, or should it be combined with other factors?
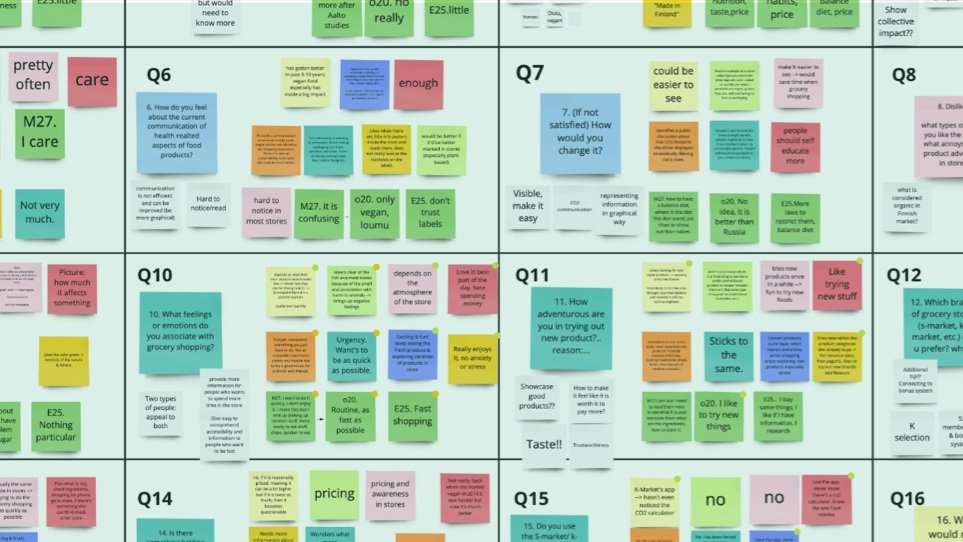
MAIN FINDINGS FROM THE INTERVIEWS
Motivation vs. lack of knowledge regarding CO2 footprint
Most of the people we interviewed wanted to consume consciously but lacked knowledge of the footprint of different products. We thus identified a need for educating consumers on carbon footprint.
Communication could be better
We found out that there was room for improvement regarding the communication about sustainability and carbon footprint in stores. The communication about vegan products seemed to be sufficient.
No awareness of the calculator
An interesting finding was that most of the people we interviewed used the app but none of them were aware of the carbon footprint calculator.
PERSONAS
Based on our interviews, we landed on two main personas: the stressed dad and the inspired home chef. We wanted a solution that would work for both types of personas.
OUR APPROACH
Making it as effortless as possible for both consumers to get the information!
Based on our research, we were able to refine our initial ideas. We identified that where we can have the biggest impact on various consumer’s purchase behavior, regardless of their motivation towards sustainability and dietary change, is within the grocery stores themselves. There are many opportunities to impact also those consumers who are not interested enough / are not able to download an app for tracking their consumption.
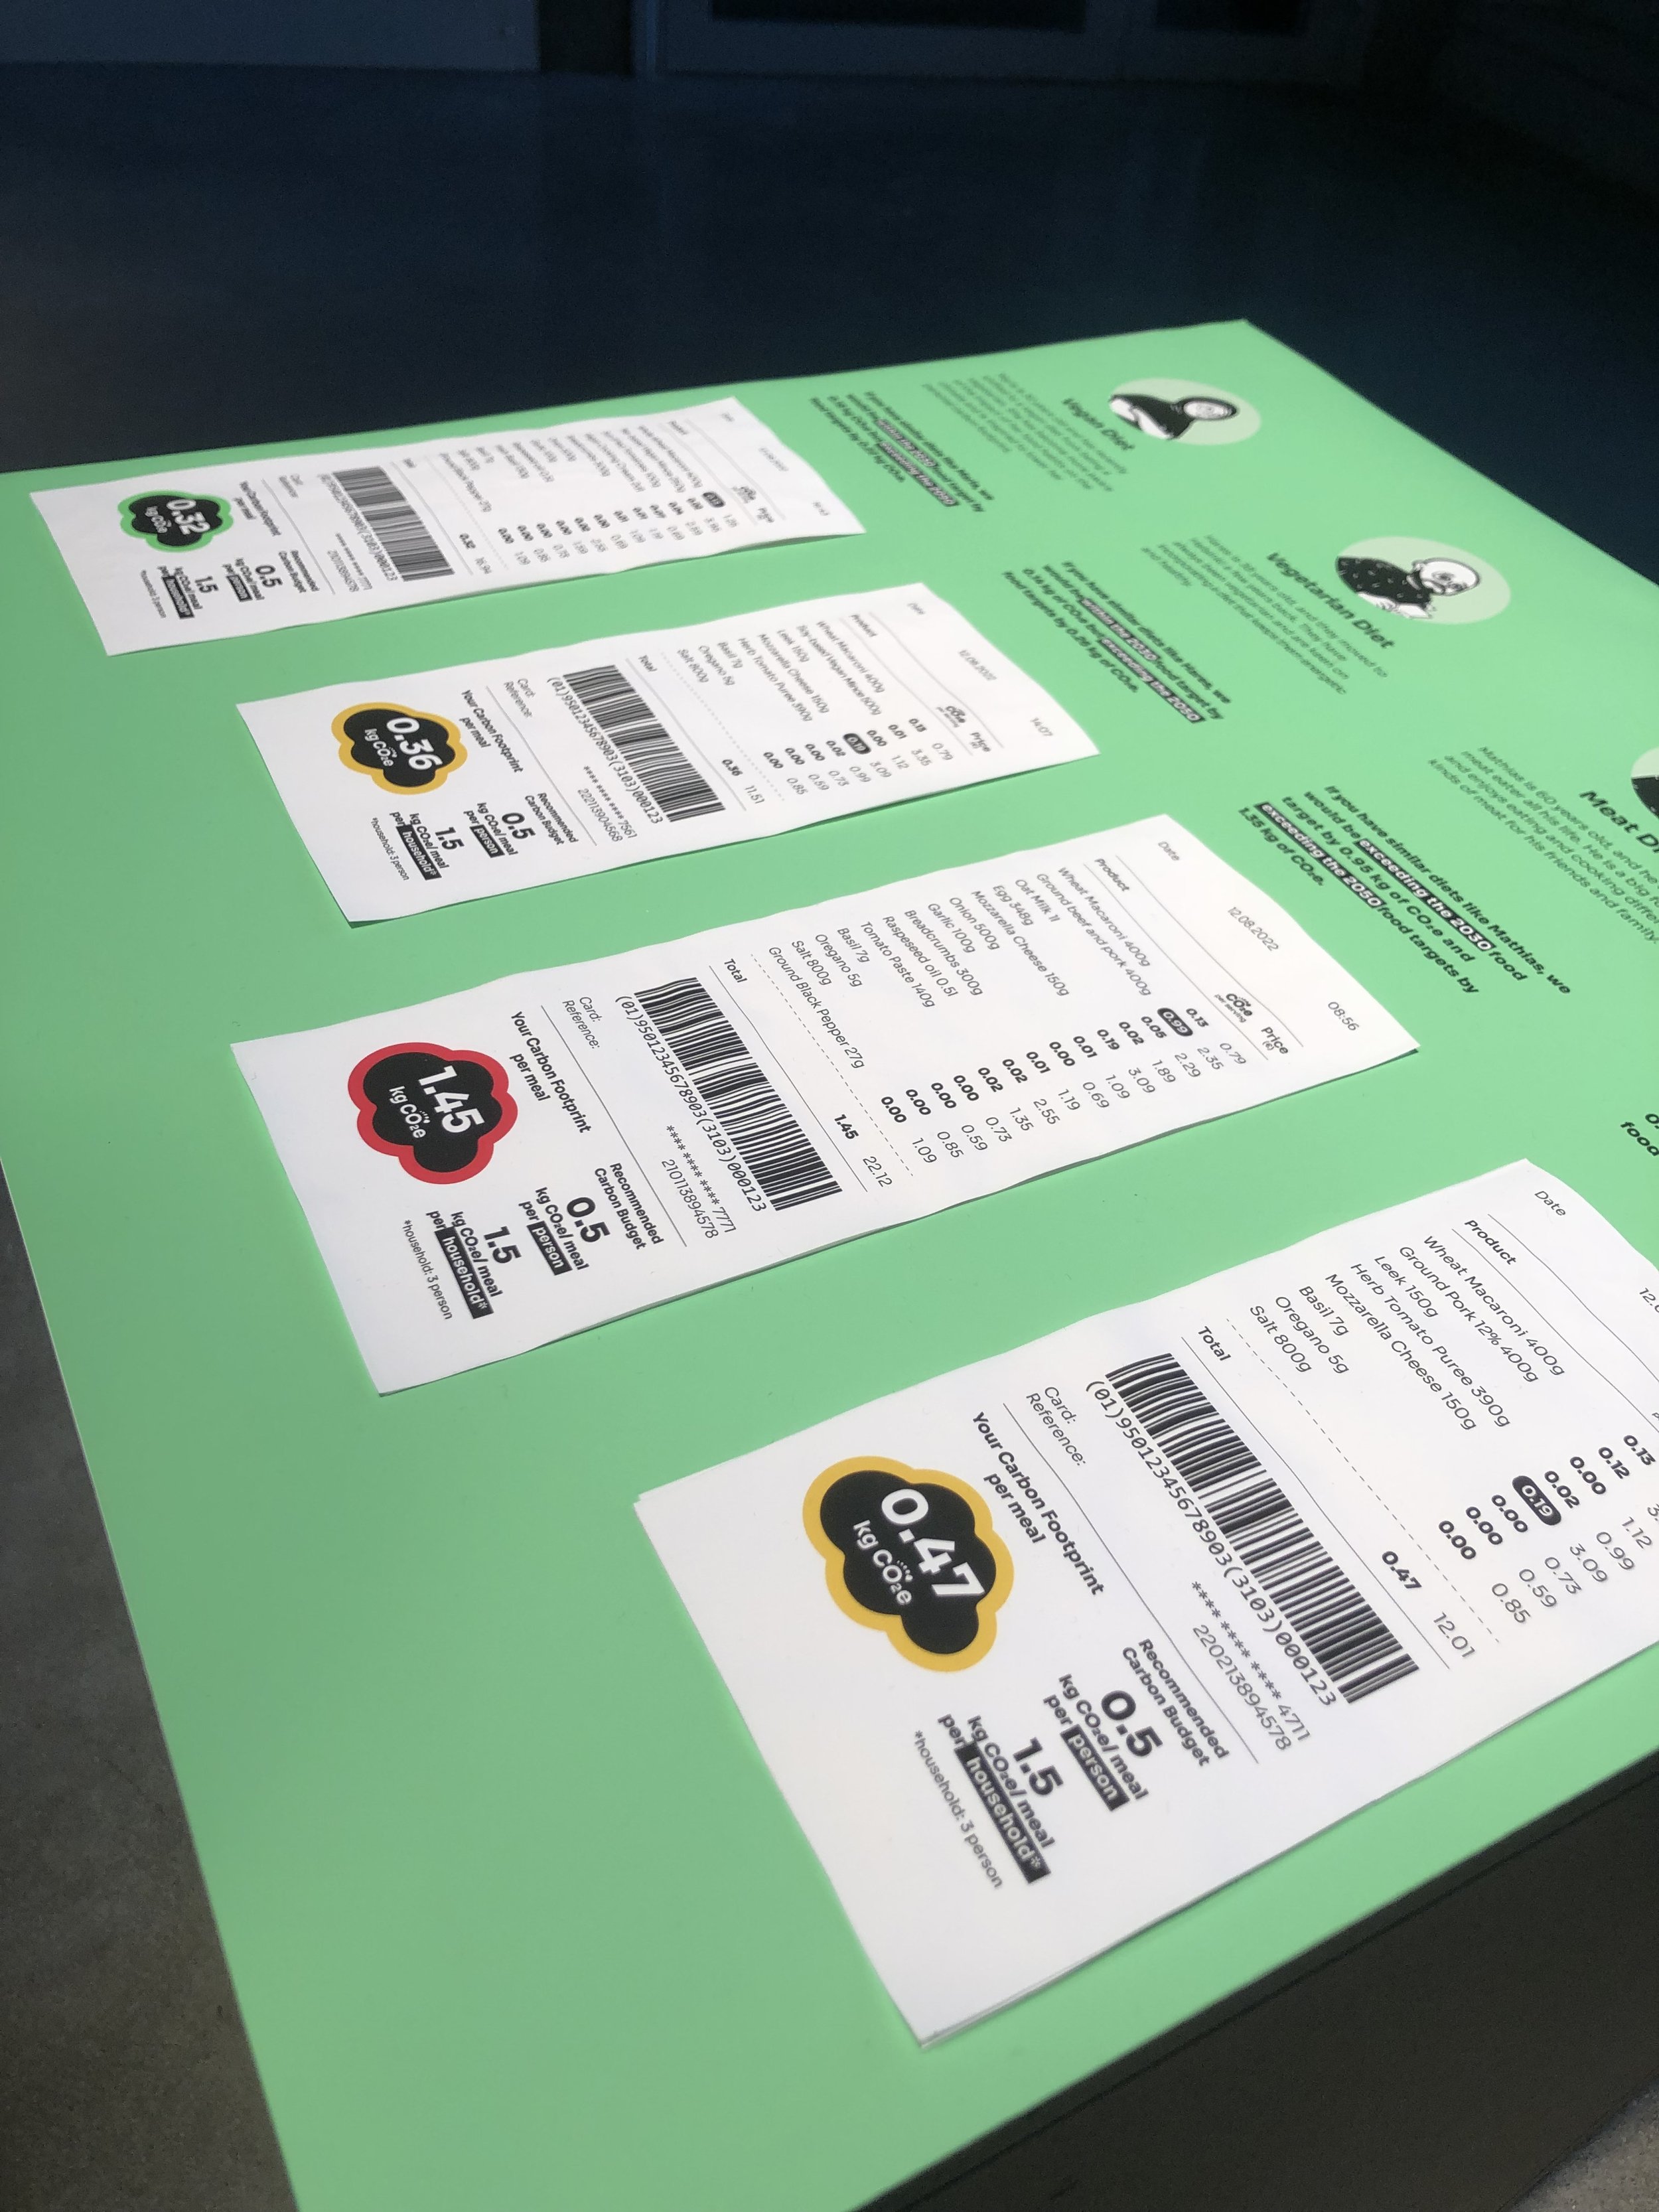
Final Solution & Designs
Illustrations and mockups were created by Laras Zita Tedjokusumo and myself
STEP 1: LEARN
Step 1 focuses on making information about the carbon footprint of food eye-catching, memorable, and easy to digest. This would be through a series of posters, screens, and signs in order to make sure that consumers are made aware of problems related to the food industry as well as steps to create change.
To ensure that consumers stay motivated and do not feel overwhelmed, we have designed our campaign in an approachable way. This includes more positive wording, a vibrant color palette, and simple illustrations. The posters would be placed throughout the stores (especially by the store entrance, and near the meat and dairy sections) and in store windows.
The campaign overall, as well as the signage, is meant to be clear, fun, and appropriate for our personas.
In order to appeal to a variety of consumers, the posters vary from more text-based to more illustration-based. The posters also encourage consumers to look for products within the low carbon footprint sections by looking for the green color coding or the low carbon footprint labels.
The letter O and the dots above it in “low carbon footprint” resemble a foot. Since the dots are getting smaller, they also represent the carbon footprint getting lower.
The green color not only stands out, but is also related to sustainability. Paired with white text, they help balance each other and feel fresh.

Another part of our campaign emphasizes visualizing the carbon budget, specifically showing comparisons of the average Finn’s footprint versus the budget, through the size of the product categories themselves.
On the right side is also a visual of a shopping cart with a variety of food items in them, to show that reducing one’s carbon footprint does not have to mean just cutting out items. The visual encourages consumers to reimagine what their shopping carts can look like and how it can be exciting to try new products. This aims to make it clear to consumers, without shaming anyone, about which products tend to be causing the largest impact and about how implementing just a few changes in purchases can be beneficial.
They would be printed on large banners, located by the dairy and meat sections, so that they are easy to spot and would bring awareness. This helps make the carbon budget easier to understand and more concrete, instead of it being an abstracted concept.
STEP 2: Choose
Focusing on decision-making before purchasing, the labels are designed to stand out and be clear. For this reason, we opted for red, orange, and green, along with white text to mark the different sections of low, mid, and high, based on carbon footprint intensity. The carbon intensity would be done according to the methods created together with Luke, which S-Group already uses in their app.
Since the dairy and meat sections have such large ranges in carbon footprint, and “dairy products are some of the top selling grocery items” (BusinessNES, 2021), the color coding would only be for those sections (Yle, 2015).
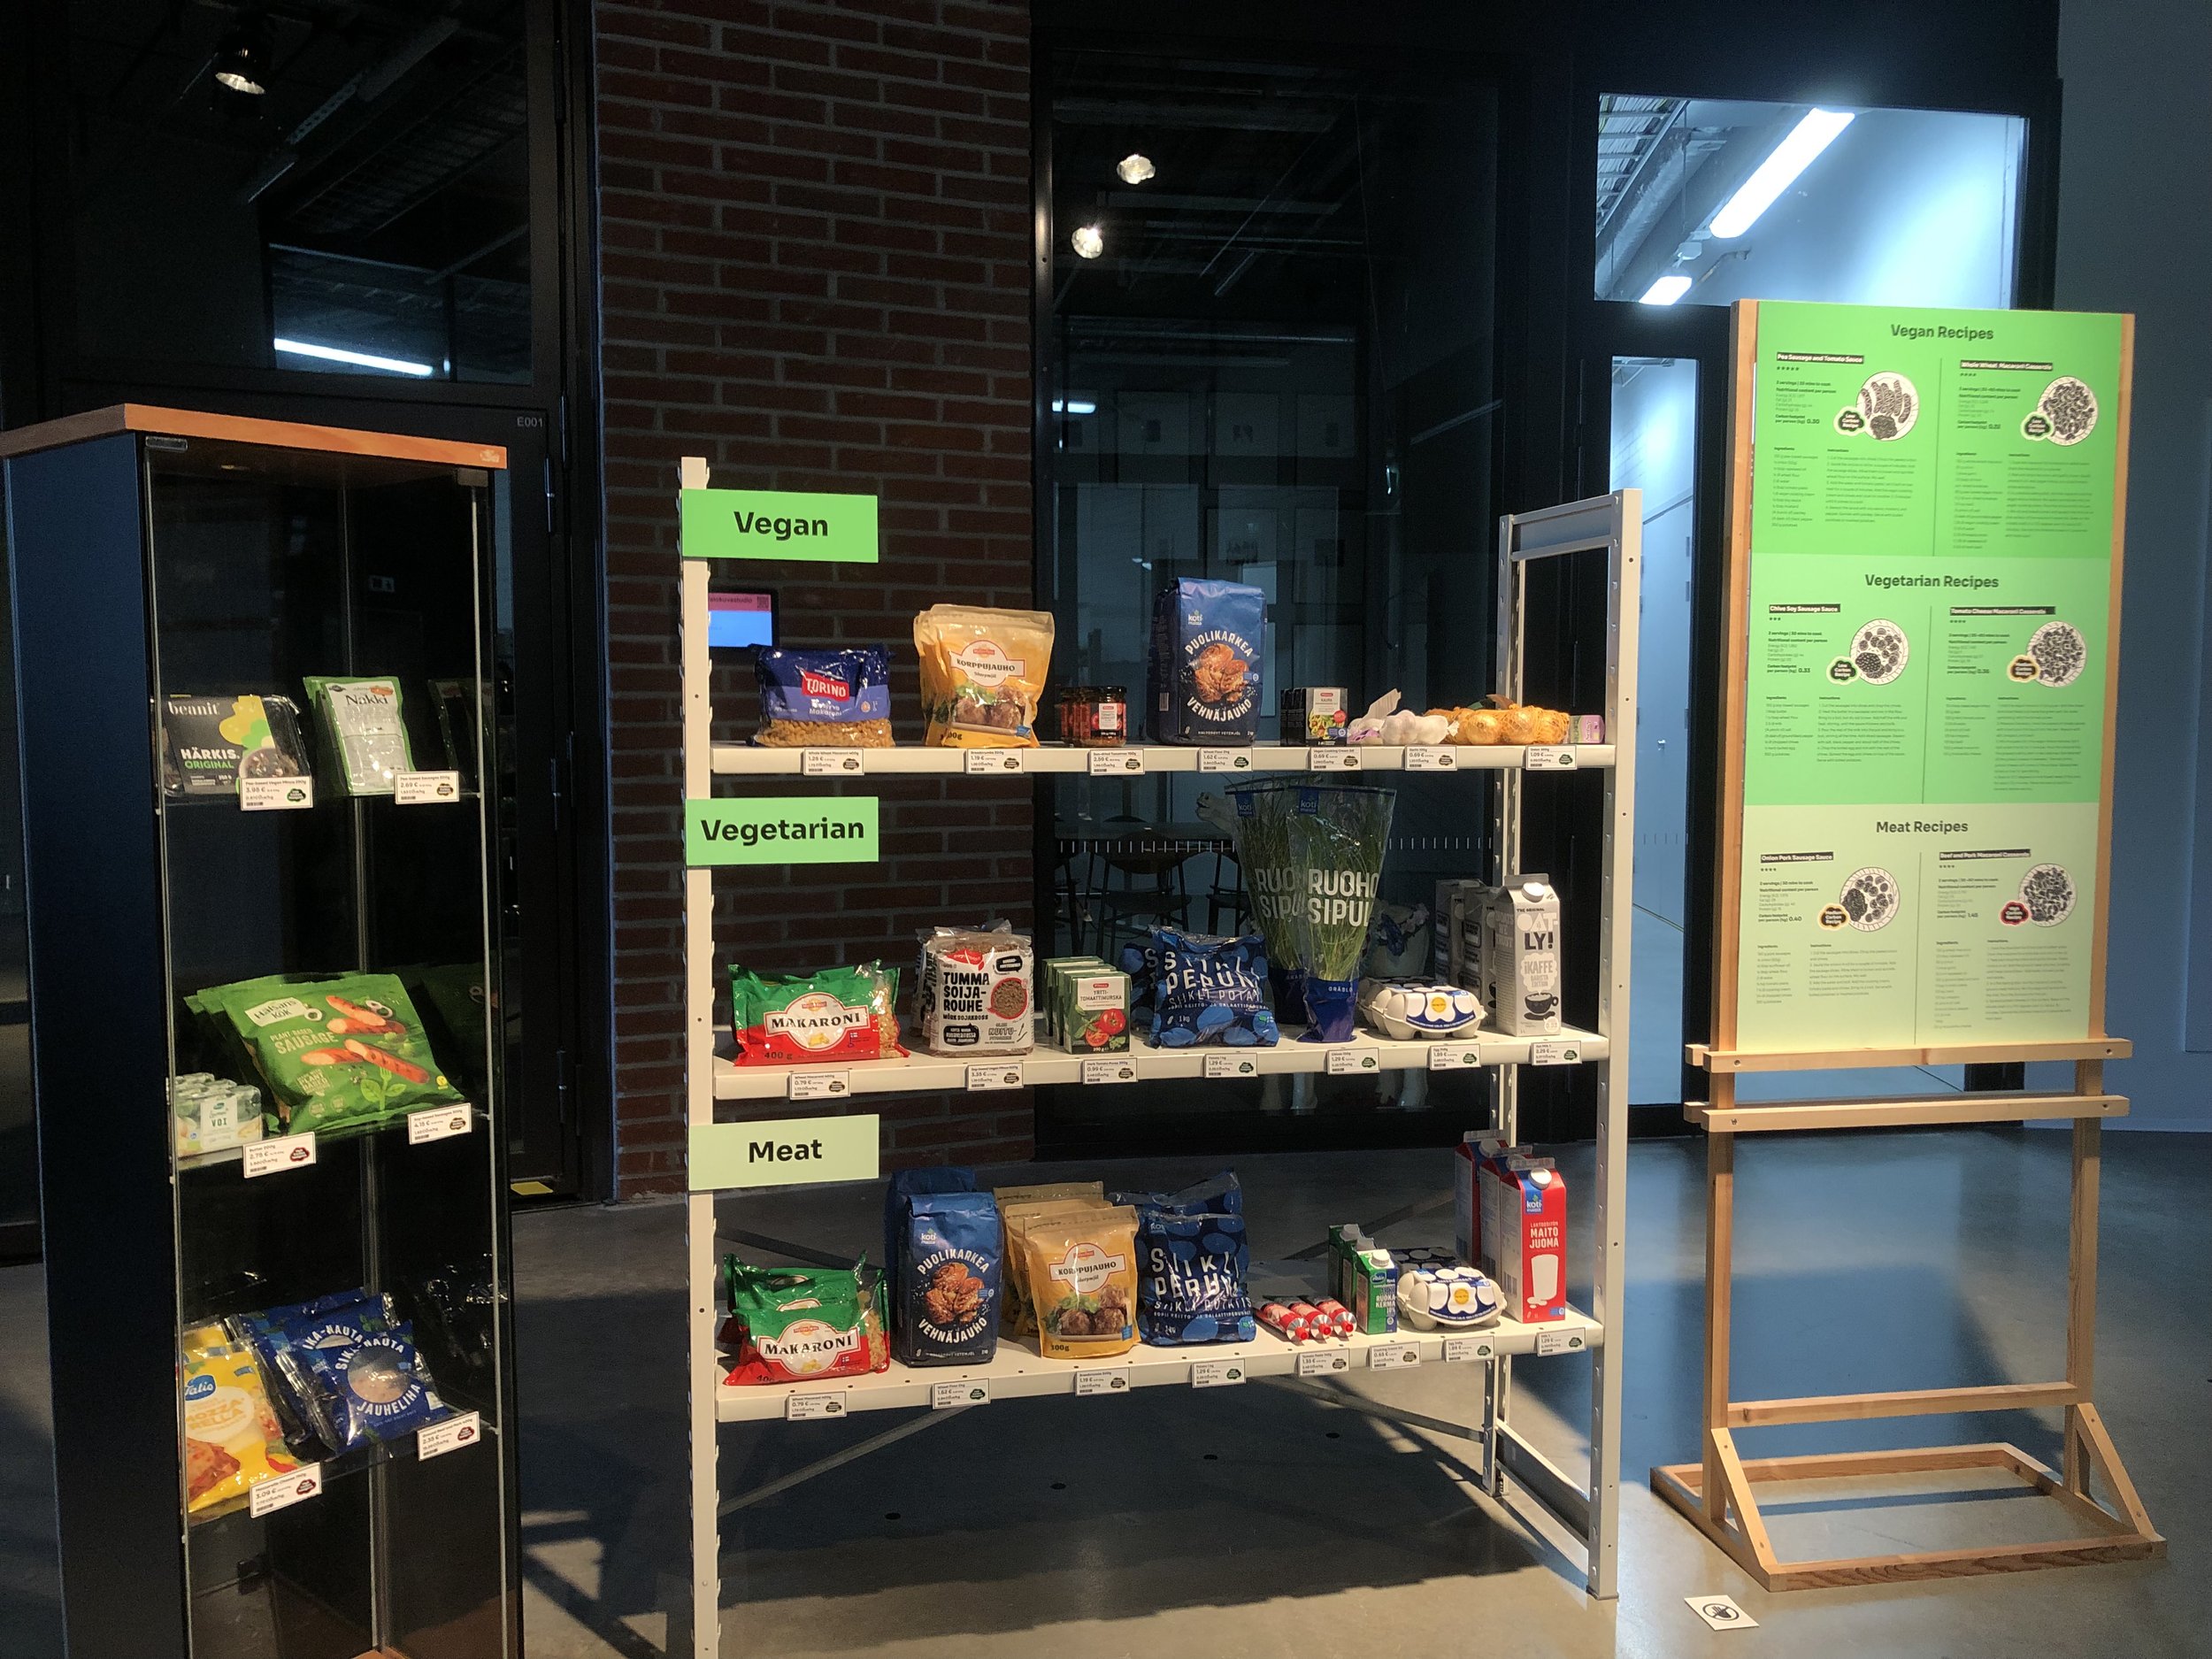
Based on research about effective signage in grocery stores (Keenan, 2021), in order for consumers to clearly see the signs, we decided on a combination of labeling above the product sections, between the sections, and on the floor. The floor decals would only be for the low carbon footprint product section and could highlight some of those food options.
By having all of the meat and plant-based alternatives in one section, it would be quick for consumers to find and easily show what alternatives are available in the store.
Alongside the labeling and shelving arrangements, would be the posters from Step 1 so that consumers can continue to learn about the carbon footprint of food and understand why changes were implemented.
STEP 3: Track
To help build the habit of shopping sustainably, the last step of our solution is to Track & Evaluate.
The S-Group's app' S-mobiili has a carbon calculator feature. However, from our interview, those who used the application were not aware of the existence of this feature. Moreover, other customers do not use the app entirely.
Our solution focuses on making the calculator accessible for all customers and easier to access the carbon calculator in the app.
In the “Evaluate” part of step 3, customers would get personalized, easy-to-understand statistics about their purchases and progress at the end of every month to maintain this habit.
Focusing on customers' positive changes and tips or recommendations on less carbon-intensive products they can buy on their next trip to the grocery store. This will encourage customers to keep this lifestyle and make the transition to a more sustainable diet guilt-free.
The statistics will be visualized in a shareable format to share it through social media and hopefully inspire their followers to check out this campaign in S-group stores and download the app as well.
LIMITATIONS
We recognize that there are a few limitations with our solution.
First, it does not take into account the total food consumption of consumers. Right after the store visit consumers might go to another store and buy more, which then would not be addressed in S-groups calculator. In the future, it would be interesting to engage in a collaboration between multiple stores to enable consumers to actually track their footprint more realistically. However, our solution highlights the impact of small choices and provides values with which consumers can compare their shopping carts.
Second, consumers respond differently to certain type of advertising. Some consumers may be motivated by seeing their carbon footprint and its impact, while other consumers may feel attacked for instance. Therefore, it is possible that some of the infographics might create adverse reactions in consumers.
Third, we haven't had the chance to do user-testing for our visual materials due to time limitations. So we haven't assessed the effectiveness of our solution and whether the customers will react positively or negatively to our campaign.
WRAPPING UP
Although there are some limitations, we want to emphasize the strengths of the solution as well. Our final designs help both personas and aim to create meaningful change through various mediums.
REFERENCES
2020 consumer research shows sustained support for carbon labelling on products. (2020, April 24). The Carbon Trust.
Akenji, L. (2021, October). 1.5-Degree Lifestyles: Towards A Fair Consumption Space for All.
Average Finnish grocery list includes beer and sweets. (2015, January 23). News. https://yle.fi/news/3-7756126
BusinessNES. (2021, December 5). List of 100 Top Selling Grocery Items 2021 & Tips. https://businessnes.com/list-of-top-selling-
grocery-items-and-tips/
Decreasing the carbon footprint of supermarket shopping: Lessons from. (2019, May 24). Yale Environment Review.
Hargreaves, T. (2011). Practice-ing behaviour change: Applying social practice theory to pro-environmental behaviour change.
Journal of Consumer Culture, 11(1), 79–99. https://doi.org/10.1177/1469540510390500
Keenan, M. (2021, June 28). How Retail Signage Works and Why You Should Care. Shopify. https://www.shopify.com/retail/retail-
signage
Meadows, D. H., Sustainability Institute, & Sustainability Institute. (1999). Leverage Points. Sustainability Institute.
Panzone, L. A., Ulph, A., Zizzo, D. J., Hilton, D., & Clear, A. (2017). The Impact of Environmental Recall and Carbon Taxation on the
Carbon Footprint of Supermarket Shopping. SSRN Electronic Journal. https://doi.org/10.2139/ssrn.3068222
Salo, M., & Nissinen, A. (2017). Consumption choices to decrease personal carbon footprints of Finns. SKYE.
